the cosmic microwave background
(CMB)
what it is
Discovered accidentally in 1963 by Penzias and Wilson (Nobel Prize,
1978), the CMB is a remnant of the hot, dense phase of the
universe that followed the Big Bang. For several hundred
thousand years after the Big Bang, the universe was hot enough for
its matter (predominantly hydrogen) to remain ionized, and
therefore opaque (like the bulk of the sun) to radiation.
During this period, matter and light were in thermal equilibrium
and the radiation is therefore expected to obey the classic
blackbody laws (Planck, Wien, Stefan).
The existence of the CMB is regarded as one of three
experimental pillars that point to a Big Bang start to the
universe. (The other two pieces of evidence that indicate
that our universe began with a Bang are the linearity of the
Hubble expansion law and the universal cosmic abundances of the
light element isotopes, such as helium, deuterium, and lithium.)
At some point about 400,000 years after the Bang, the universe had
cooled to the point where the matter became neutral, at which
point the universe's matter also became transparent to the
radiation. (Completely ionized matter can absorb any
wavelength radiation; neutral matter can only absorb the
relatively few wavelengths that carry the exact energy that match
energy differences between electron energy levels.) The
temperature at which this transition from ionized to neutral
(called the "moment of decoupling") occurred was roughly 3000 K.
The spectrum as measured by the COBE satellite looks like

It indeed had the blackbody spectral shape predicted, but the
peak in the microwave spectrum indicated a temperature of 2.726
K. Although this temperature is clearly insufficient to
ionize hydrogen, the entire spectrum has been redshifted from that
at the moment of decoupling (when the temperature was 3000
K) by the expansion of the universe. As space expands, the
wavelengths of the CMB expand by the same factor. Wien's
blackbody law says that the wavelength peak of the CMB spectrum is
inversely proportional to the temperature of the CMB.
Therefore, the drop in the CMB temperature by a factor of 1100 (=
3000 K/2.73 K) indicates an expansion of the universe by a factor
of 1100 from the moment of decoupling until now.
what it can tell us
In addition to measuring the
temperature of the overall CMB, anisotropies in the CMB are
capable of telling us the Earth's motion with respect to the
CMB, the geometry (or curvature) of the universe, the baryon
content of the universe, the dark matter and dark energy content
of the universe, the value of the Hubble constant, whether
inflation incurred in the early universe, and more.
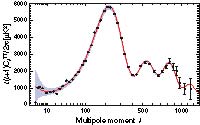
What various groups are measuring is usually presented in a
format such as


BOOMERandG in April
2001
WMAP
February 2003 WMAP Feb 2011
what it means
The above diagrams plot the CMB power as
a function of harmonic number. These diagrams are very
much like that for a complex musical instrument note, which is
also the sum of the amplitudes (or "power") of various
frequencies or harmonics. For example, in the diagram
below, 6 harmonics (top picture: each is a sinusoidal wave with
an integral multiple of the fundamental frequency) are added
together to produce the complex-shape wave shown in the middle
picture. The bottom picture shows the relative amplitude
contribution of each of the harmonics.

The CMB power spectra similarly plot the
relative contribution of each spatial frequency (instead of
temporal frequency).
the math and physics of anisotropies
 If the CMB had precisely the same temperature in
every direction in the sky, the sky would have the same brightness
in every direction. Astronomers often use a false coloring
scheme to represent brightness (different brightnesses are
represented by different colors) especially when the radiation is
being emitted in a part of the spectrum that is not visible to the
human eye. A uniformly bright CMB would therefore be
represented by a single color. This power is called the "l =
1" contribution to the power spectrum. If we could see the
CMB with our eyes, the sky would look uniformly the same, as in
the figure at the left.
If the CMB had precisely the same temperature in
every direction in the sky, the sky would have the same brightness
in every direction. Astronomers often use a false coloring
scheme to represent brightness (different brightnesses are
represented by different colors) especially when the radiation is
being emitted in a part of the spectrum that is not visible to the
human eye. A uniformly bright CMB would therefore be
represented by a single color. This power is called the "l =
1" contribution to the power spectrum. If we could see the
CMB with our eyes, the sky would look uniformly the same, as in
the figure at the left.
(In this and subsequent diagrams,
the entire sky is represented by a Mercator projection, the same
technique often employed to portray the entire earth. The
equator (latitude 0 for earth) is a horizontal line in the middle
of the oval, with northern latitudes above and southern latitudes
below. The Greenwich meridian (longitude 0 on Earth) is a
vertical line through the middle, with western longitudes to the
left and eastern longitudes to the right. In a similar
manner, the galactic equator or plane (latitude 0) is a line
running through the middle of the sky pictures. The galactic
center (galactic longitude 0) is at the center of the diagram.
 In reality,
however, not all directions in the sky appear to have the same CMB
brightness. The earth is moving with respect to the matter
that last emitted the CMB, and therefore the CMB spectrum looks
bluest (and, by Wien's law, therefore hottest) in that direction
and reddest (and coolest) opposite to that direction. This
effect would contribute to the CMB power spectrum at a spatial
frequency of l = 2. The "l = 2" contribution is often called
a dipole contribution, because the brightness distribution over
the sky has 2 poles (one hot, one cool) in it. If we were
somehow able to see ONLY this dipole contribution [the brightness
amplitude of which is far less than the that of the dominant "l=1"
contribution] by removing the average brightness (or temperature)
from the preceding diagram and amplify the contrast by
approximately a thousand, the sky now looks like the figure at the
right.
In reality,
however, not all directions in the sky appear to have the same CMB
brightness. The earth is moving with respect to the matter
that last emitted the CMB, and therefore the CMB spectrum looks
bluest (and, by Wien's law, therefore hottest) in that direction
and reddest (and coolest) opposite to that direction. This
effect would contribute to the CMB power spectrum at a spatial
frequency of l = 2. The "l = 2" contribution is often called
a dipole contribution, because the brightness distribution over
the sky has 2 poles (one hot, one cool) in it. If we were
somehow able to see ONLY this dipole contribution [the brightness
amplitude of which is far less than the that of the dominant "l=1"
contribution] by removing the average brightness (or temperature)
from the preceding diagram and amplify the contrast by
approximately a thousand, the sky now looks like the figure at the
right.
By measuring the amount of the dipole anisotropy (the bluest
part of the sky is .0033 K hotter than average), we can determine
the magnitude of the earth's motion with respect to the CMB: the
earth is moving at a speed of 370 km/s in the direction of the
constellation Virgo.

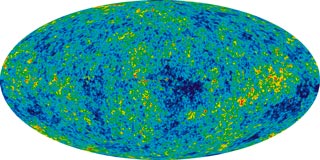
If the dipole contribution due to Earth's motion is now
subtracted out, the sky looks like the figure at the left.
The temperature differences that remain are a composite of two
things: a contribution from our galaxy and the true anisotropies
in the CMB that were present at the moment of decoupling, hundreds
of thousands of years after the Big Bang.
The galaxy is bright at microwave wavelengths due to emission
by molecules (particularly CO), dust,
The anisotropies present at the moment of decoupling represent
random noise present in the very early universe that was amplified
by inflation to cosmic-sized scales. The anisotropies
present at the moment of decoupling are of the appropriate
magnitude to account for how the large-scale structures that we
see today (from galaxies to superclusters of galaxies) formed
under the influence of gravity.
It is possible to remove the contribution of the galaxy's emission
by measuring
Once the galactic contribution is removed, COBE saw this:

This diagram is the sum of the amplitude (or power)
contributions of all spatial frequency harmonics (but with those
of l = 1 and l = 2 removed). It is the equivalent of the
complex wave musical instrument wave shape above, which was formed
by the sum of the amplitude (or audio power) contributions of
several temporal (or harmonic) frequencies. The difference
is that the CMB diagram shows the power as a function of position
in the sky (i.e., as a function of galactic latitude and
longitude), whereas the musical instrument wave shape shows the
power as a function of the single dimension of time.
The goal for the CMB researchers is to decompose the CMB diagram
into its harmonic components. And fortunately the relative
amounts of the harmonic components are determined by intrinsic
properties of the universe (such as the Hubble constant, the
amount of dark matter, and the value of the cosmological constant,
the age of the universe, and the amount of dark energy).
WMAP sees this (2011)
who is measuring this
COBE
(Cosmic Background Explorer, launched in 1989) was the first
satellite launched to measure the CMB properties outside Earth's
atmosphere. COBE established the precise blackbody character
of the radiation and measured the temperature as 2.726 K, measured
the earth's velocity relative to the matter that last emiited the
radiation, and eventually detected anisotropies in the background
at the level of 1 part in 105. Mather and Smoot
won the Nobel
Prize
in 2006 for their work with COBE
BOOMERanG
measures CMB properties by launching balloon-borne instruments at
the South Pole. Here is their latest version of the
anisotropy of a piece of the sky
MAXIMA
does the same

NASA/WMAP Science Team
MAP (launched 6/30/01)
will measure the individual properties of the universe (e.g., the
Hubble constant, the baryon density, the cosmological constant
value) to within 5%. The first MAP pictures (feb 2003) is on
the left with the COBE result from 5 years earlier for
comparison. Note that the MAP resolution is significantly
better than the COBE resolution.
MAP
found the following values (2003) for cosmological
parameters:
present age: 13.7 (+
0.1) Gyr
geometry of the universe: consistent with flat: omega total = 1.02 + 0.02
omega (dark energy) = 0.73
omega (dark matter) = 0.23
omega (baryons) = 0.044 + 0.004
omega (neutrinos) <
0.0005
omega (radiation) = 0.0001
the content of the universe: 
epoch of first star formation (end of the dark ages): 200 Myr
after the Bang
moment of decoupling: 379,000 yr after the Bang
Hubble's constant = 71 (+ 3) km/s/Mpc
WMAP 2011 results:
present age
= 13.7 (+ 0.13) Gyr
Hubble constant now
= 71.0 + 2.5 km/s/Mpc
He production in Big Bang
= 0.28 + 0.013
geometry of the universe:
omega total
= 1.001 + 0.02
omega (dark energy)
= 0.727 + 0.030
omega (dark matter)
= 0.228 + 0.027
omega (baryons)
=
0.0455 + 0.0028
omega (neutrinos)
< 0.0005
omega (radiation)
= 0.0001
Planck
is ESA's satellite (launched May 2009) to study the CMB. Its
coolant ran out in January 2012. New results will be
presented in February 2012
theory:
how YOU can calculate the spectrum anisotropies from universe
parameters
go to Max's
cosmic cinema, where you plug in your own parameters for the
universe and see the resulting anisotropy plot interactively...
you can then see how well it fits the observations
Physics Today articles
3K Cosmic Background
