Enter the following to get a list of the currently available tests. This list will likely vary as I think up and add more, and some of the tests that are here are likely to be "experimental".
rgb@lucifer|B:1845>benchmaster -l
 #   Name                     Remark
========================================================================
 0 Null test Test validation loop, returns timer harness resolution.
 1 bogomflops d[i] = (ad + d[i])*(bd - d[i])/d[i] (8 byte double vector)
 2  stream copy         d[i] = a[i] (8 byte double vector)
 3  stream scale        d[i] = xtest*d[i] (8 byte double vector)
 4  stream add          d[i] = a[i] + b[i] (8 byte double vector)
 5  stream triad        d[i] = a[i] + xtest*b[i] (8 byte double vector)
 6  memory read/write   Reads, then writes 4 byte integer vector
 7  memory read         Reads (4 byte integer vector)
 8  memory write        Writes (4 byte integer vector)
 9  savage              xtest = tan(atan(exp(log(sqrt(xtest*xtest)))))
10  square root test    result = sqrt(xtest)
11  multiply test       result = xtest*ytest
12  divide test         result = xtest/ytest
13  timenano test       result = xtest*ytest
14  timesleep test      result = xtest*ytest
Back to top
This was my original "MFLOPS" benchmark. I've been testing this particular fragment for something like sixteen or seventeen years, although my early results used very crude timers and were probably not terribly reliable. It includes division because much of my code includes division. Most benchmarks that yield "floating point operations per second" (flops) omit it, perhaps because it is a lot slower than multiplication or addition so that including it makes processors "look bad". Benchmarketing vendors hate that. Imagine that.
Note that on most systems division is slow enough that this is not, actually, much of a test of memory bandwidth a la stream.
rgb@lucifer|B:1844>benchmaster -t 1 -s 1000000
#==========================================================================
#                          Benchmaster 1.0.1
#                      Copyright 2004 Robert G. Brown
#
#==========================================================================
#                          Host Information
# hostname: lucifer             compiler/flags: gcc -O3
# CPU:  GenuineIntel  Intel(R) Pentium(R) 4 CPU 1.80GHz at  1804.509 (MHz)
# CPU: L2 cache: 512 KB    bogomips:  3555.32
# Total Memory: 517164    (Current) Free Memory: 98876
# cpu cycle counter nanotimer: clock granularity (nsec/cycle) = 98.152
#==========================================================================
#                          Test Information
# Test:        bogomflops
# Description: d[i] = (ad + d[i])*(bd - d[i])/d[i] (8 byte double vector)
#
# Number of samples: 100    xtest: 3.141593    vector order: unshuffled
# full iterations = 2    empty iterations = 131072
# time full = 24732745.904842 (nsec)   time empty = 12.970211 (nsec)
#
#    test name           vlen   stride  time +/- sigma (nsec)  megarate
#==========================================================================
"bogomflops"           1000000     1  6.18e+00  6.66e-03      1.617e+02
Back to top
This is a venerable transcendental function benchmark. My original code fragment for this is also close to 20 years old, and I no longer know where I got it or who Savage was. Still, it's a pretty good benchmark for people whose code contains a lot of trancendental calls. Like me.
rgb@lucifer|B:1846>benchmaster -t 9
#==========================================================================
#                          Benchmaster 1.0.1
#                      Copyright 2004 Robert G. Brown
#
#==========================================================================
#                          Host Information
# hostname: lucifer             compiler/flags: gcc -O3
# CPU:  GenuineIntel Intel(R) Pentium(R) 4 CPU 1.80GHz at 1804.509 (MHz)
# CPU: L2 cache: 512 KB    bogomips:  3555.32
# Total Memory: 517164    (Current) Free Memory: 98876
# cpu cycle counter nanotimer: clock granularity (nsec/cycle) = 111.890
#==========================================================================
#                          Test Information
# Test:        savage
# Description: xtest = tan(atan(exp(log(sqrt(xtest*xtest)))))
#
# Number of samples: 100    xtest: 3.141593    vector order: unshuffled
# full iterations = 1024    empty iterations = 2048
# time full = 1201.340512 (nsec)   time empty = 599.420111 (nsec)
#
#    test name           vlen   stride  time +/- sigma (nsec)  megarate
#==========================================================================
"savage"                  1000     1  6.02e+02  5.96e-01      1.661e+00
Back to top
The following is an example that uses a simple perl script to generate results for the integer read/write test for a range of vector sizes. The vector size is doubled every time through, but that size+1 is also computed to reveal the penalty associated with odd sizes (if any). The test is run twice, the second time the vector order is shuffled, defeating the cache.
rgb@lucifer|B:1852>log-plot-benchmaster -t 6 > lucifer_unshuffled_rw.data
rgb@lucifer|B:1858>log-plot-benchmaster -t 6 -r > lucifer_shuffled_rw.data
Results of tests like this are best seen on a graph. Here are the results plotted as a function of the log of the vector size. Note that the actual length of the data stream being moved in integer size chunks is sizeof(int)*size (4*size in this particular case). The cache size of lucifer can be seen above in the report headers. Note the interesting structure and split that occurs at various points both inside and beyond the cache boundaries.
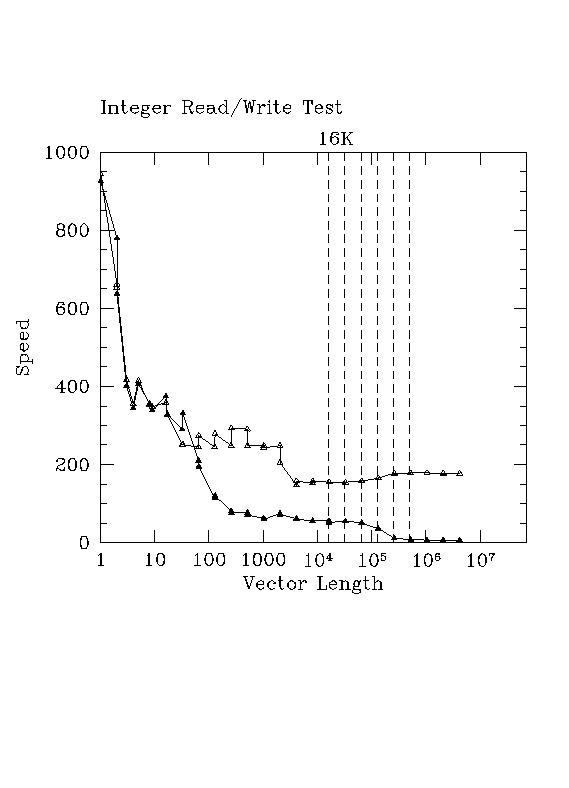
In this figure, open triangles are unshuffled and filled triangles are shuffled order. Some "sawtoothing" of the speed is clearly observed, indicating that copying odd numbers of integers is sometimes faster or slower than even numbers of integers in a single loop pass.
Back to topBenchmaster can run all four of John D. McCalpin's stream code fragments with variable vector length, number of samples, and number of iterations per sample. One use of this is to generate a graph of stream performance (see below). However, if you are a traditionalist or "just want to run stream", you might not know the correct default values to match the stream sources, so I distribute a small shell script that has them built in.
Benchmaster's embedded stream differs in certain ways from stream. For example, unless you tell benchmaster to do otherwise, it will use the average timing instead of the best timing, making it a bit slower than stream (but more realistic as a predictor of real world performance, which is what I care about in contrast to the peak performance that vendors are inclined to sell you). It takes the time to carefully tune iterations to get reliable results. It subtracts out the test overhead (the "empty loop" time). It rejects times that are more than 5% too high or two low once it has increased iterations to where that sort of variation should not occur unless it is caused by external events affecting system state (like the operating system running a competing application). It runs each test separately in its own benchmaster invocation (some part of the reused vectors could still be in cache in regular stream and cannot in benchmaster). Vectors are allocated with malloc instead of being static. The timer has a resolution of a few nanoseconds instead of microseconds or worse, and the overall timing harness has a resolution as small as a few thousands of a nanosecond when run over hundreds of thousands of iterations. So this is not exactly stream.
Nevertheless, the results obtained are usually very close (within a few percent) of stream results, which is encouraging all around.
rgb@lucifer|B:1848>stream.sh
#==========================================================================
#                          Benchmaster 1.0.1
#                      Copyright 2004 Robert G. Brown
#
#==========================================================================
#                          Host Information
# hostname: lucifer             compiler/flags: gcc -O3
# CPU:  GenuineIntel Intel(R) Pentium(R) 4 CPU 1.80GHz at 1804.509 (MHz)
# CPU: L2 cache: 512 KB    bogomips:  3555.32
# Total Memory: 517164    (Current) Free Memory: 97404
# cpu cycle counter nanotimer: clock granularity (nsec/cycle) = 98.225
#==========================================================================
#            Emulating John D. McCalpin's stream benchmark
#
# test name vlen stride time +/- sigma (nsec) Rate (MB/sec)
#==========================================================================
"stream copy"          2000000     1  1.51e+01  1.98e-03      1.062e+03
"stream scale"         2000000     1  1.50e+01  3.14e-02      1.070e+03
"stream add"           2000000     1  1.99e+01  4.34e-02      1.210e+03
"stream triad"         2000000     1  1.98e+01  3.39e-01      1.235e+03
Back to top
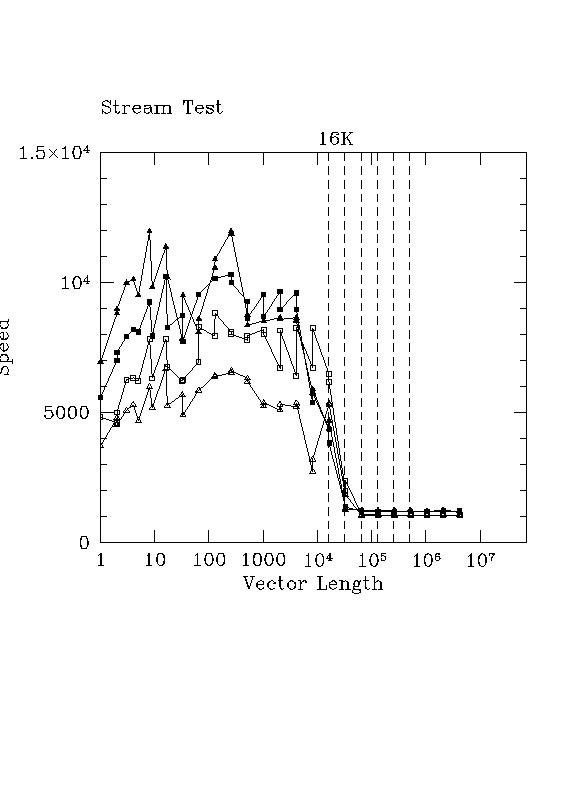
Now suppose that we run log-plot-benchmark using stream. Wouldn't we expect this to give us a lot more information than just stream alone? Check out the figure below, where open triangle is copy, open square is scale, filled triangle is add, and filled square is triad.
Is that a cache boundary I see in between 10^4 and 10^5 or what? Remember that "size" in this case is the length of the vector, not the length in bytes, so multiply by 8, 2*8, or 3*8 to get the length(s) of all the data vectors in bytes and compare to the L2 cache size indicated above. Note also how flat performance is once you are through the cache boundary (at least as far as this test went).