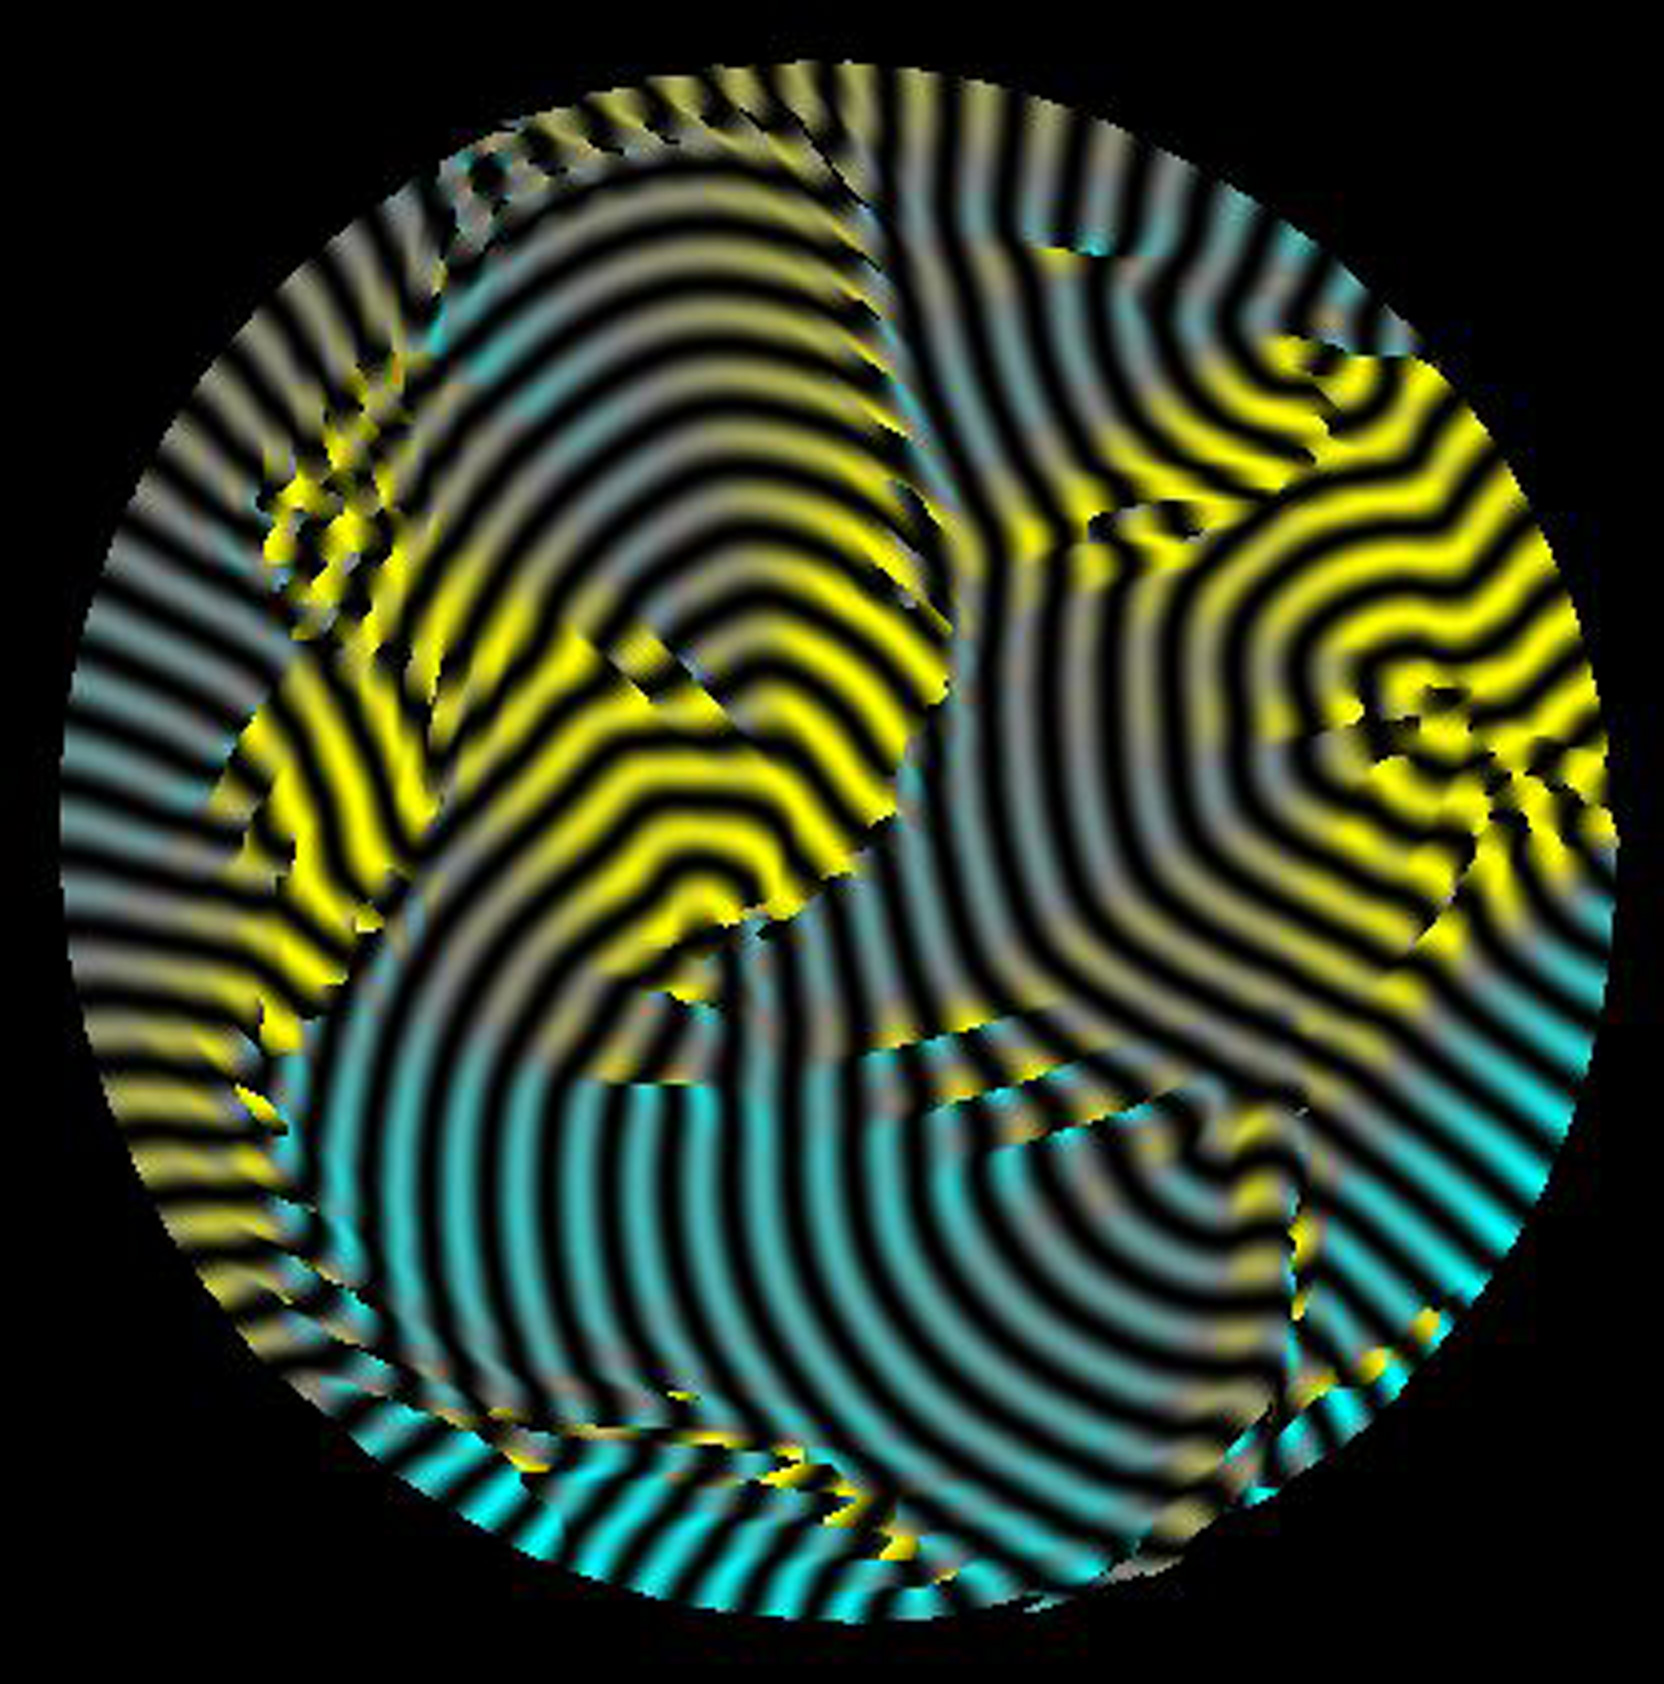
The La Porta-Surko experiment was important because it was one of the first to investigate what kind of dynamics arise from an oscillatory instability at a finite wavelength of a uniform state (a so-called type-Io instability, see Chapter 2 of the book) when an experimental cell has two large extended directions. La Porta and Surko discovered that traveling waves still occur (as they do in a system with one large extended direction) but now multiple traveling waves coexist and these can have different orientations, frequencies, and speeds. Here the color encodes the local frequencies of the traveling waves (roughly the same as the speeds of the wave), with blue and yellow areas oscillating respectively faster and slower than the average frequency. The range of frequencies ω varies from 0.25 to 0.6 radians per vertical diffusion time.
There are numerous details of this experiment which remain
poorly understood and so remain challenges to understand.
Analysis of the time-dependent pattern suggests that the
dynamics is not periodic in time nor space and so
empirically is an example of spatiotemporal chaos. As is the
case with many spatiotemporal chaotic states, it is not
clear why the pattern fails to become more regular over
time, say ordered in space or periodic in time. It is
currently not understood what determines the number of
traveling waves (for example, does the number increase with
increasing aspect ratio of the cell or with increasing
Rayleigh number?) nor their local frequencies, nor how these
details depend on experimental parameters or on the geometry
of the cell, say a cylinder versus a square box of
comparable aspect ratio.
Further details of the image and experiment: The
colored stripes correspond to regions of cooler descending
fluid, which act as weak converging lenses when light is
directed through a transparent upper surface of the cell
(the experiment used a thin sapphire plate) and reflected
off the mirror-like bottom surface of the cell (which was a
highly polished plate of pure
silicon). (See Figure 1.13
in the book which shows a schematic diagram of the
shadowgraphy method.) The black stripes correspond to
regions of warmer ascending fluid, that act as weak
diverging lenses that deflect light reflected from the
bottom plate away from the recording CCD camera above the
cylinder. The light intensity at any given point represents
a rather complicated average over the depth of the fluid of
the temperature-dependent and so spatially varying index of
refraction of the fluid. From the time-dependent movie of
the patterns, La Porta and Surko used the technique of
complex demodulation (see the
paper below) to extract a local complex-valued amplitude
field A(x,y,t)=|A|ei φ whose
phase φ(x,y,t) was used to compute and assign a
frequency to the local oscillations of each roll. A computer
program then assigned colors to each bright stripe,
depending on its frequency relative to the mean frequency
over the pattern.
We note that numerous parameters need to be specified so that the experiment that produced this figure can be replicated, or for a computer simulation to be carried out of this experiment. La Porta and Surko used the following values:
Some related images with comments are available on the Surko website http://physics.ucsd.edu/research/surkogroup/fluids. Further details such as how the local frequency was extracted from the recorded spatiotemporal data can be obtained from the the paper Dynamics of two-dimensional traveling-wave convection patterns by A. La Porta and C. M. Surko, Physical Review E 53(6):5916-5934 (1996).
